logo
logo
logo

WEB/APP

OMFARM (NDA)

OMFARM (NDA)

OMFARM (NDA)

OmFarm is a platform for smart agriculture digitalization and management, empowering farmers and businesses to optimize crop cultivation, livestock, and aquaculture processes. The brand specializes in traceability, production unit code issuance, and agricultural digital transformation.

OmFarm is a platform for smart agriculture digitalization and management, empowering farmers and businesses to optimize crop cultivation, livestock, and aquaculture processes. The brand specializes in traceability, production unit code issuance, and agricultural digital transformation.

COMPANY

ISOCERT

ROLE

PRODUCT DESIGN

TIME

JUNE 2023 - DEC 2025

STACK

FIGMA / ISS365

cover-image
  • Team Size: BA (2), UX Lead (1), Product Designer (2), Product Manager (1), Engineers (4), Testing (2),
  • Domain: Farm operation, inventory, agricultural traceability, compliance workflow
  • Scope: Field research, UX strategy, product architecture, key flows, design system logic, stakeholder alignment

Snapshot

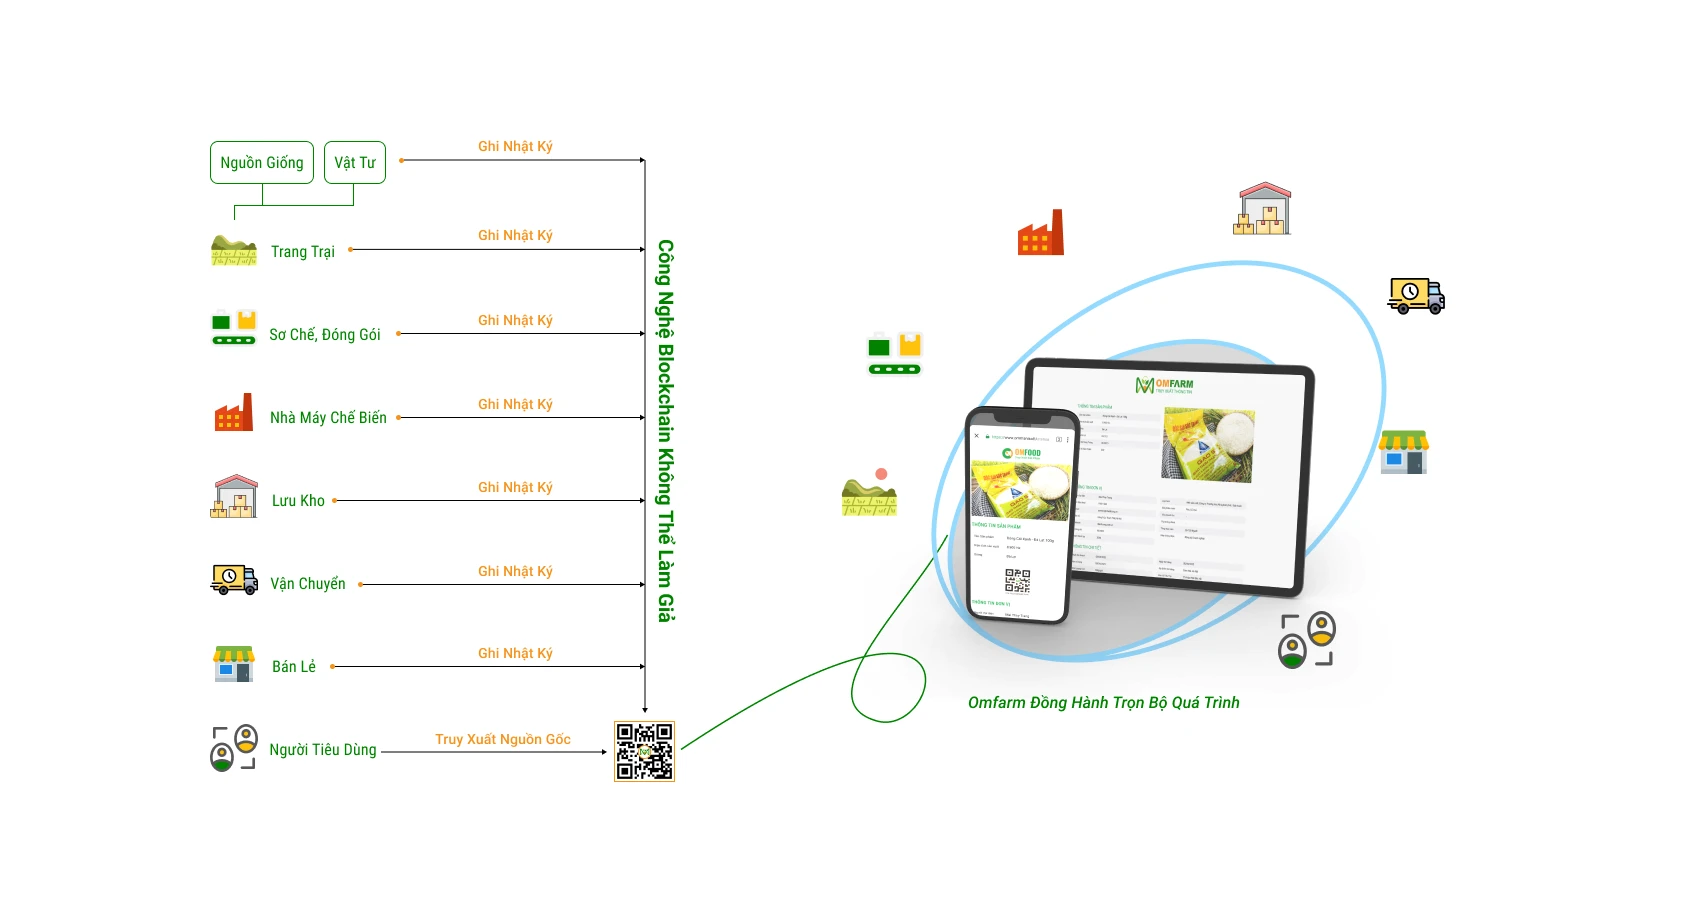
OmFarm is a web and mobile platform that helps agricultural businesses and cooperatives manage production data: from setting up foundational data, managing inventory, planning production cycles, creating work items, recording cultivation logs, assembling traceability data, generating QR codes/barcodes for products, and publishing traceability profiles for consumers or authorities to verify.

At a surface level, OmFarm could be understood as a system for “recording production logs and generating QR codes.” But after going deeper into real operations, I realized the problem was not only about the input forms or the QR page.

The bigger challenge was the gap between distributed operational data and public traceability proof.

Users do not create a traceability profile through one single action. They create products, materials, inventory records, production plans, work items, logs, harvest records, packaging records, transportation data, certifications, and batches. The QR code/barcode is only the final identity layer, attached to a product or product batch when it enters the market.

The core UX question became:

How might we design a system that helps operational data mature enough to be assigned a traceability identity and become public proof?

1. The Real Problem

The problem with OmFarm was that traceability data did not live in one place.

A final traceability profile could depend on many layers of data: products, production areas, materials, pesticides, fertilizers, equipment, inventory, production plans, work items, logs, harvesting, packaging, transportation, certifications, and business information.

If one link in this chain is incorrect or lacks context, the final QR page may still look polished, but the data behind it will not be strong enough to build trust.

The key insight from field research was:

Traceability starts from how data is created, used, connected, and controlled in daily operations.

From that point, I stopped seeing OmFarm as a production logging tool. I started seeing it as a data chain management system: data must pass through multiple layers, remain clear at each point, and only then become a public traceability profile.

2. My Role as UX Lead

My role was to help the team move from screen-based thinking to data-chain thinking.

I worked with the BA during field research, observing how agricultural businesses manage products, inventory, production plans, work items, logs, and traceability. From there, the team and I redefined OmFarm as a system with interdependent data layers, rather than a collection of disconnected modules.

My main responsibilities included:

  • Reframing the problem as traceability data chain management.

  • Defining a product model that gave the team a shared language.

  • Designing logic for the key flows.

  • Standardizing the use of forms, tables, statuses, validation messages, and QR profiles.

  • Aligning Product, Engineering, BA, and Business around trade-offs between operational speed, data control, and verifiability.

The most important part of my role was helping the team answer one shared question:

If the data at this step is wrong, where will it affect the final traceability profile?

This question helped make discussions less subjective and more focused on data risk at each layer.

3. Product Model

To prevent the team from seeing OmFarm as a list of modules, I simplified the system into four data layers:

Foundation → Operation → Assembly → Public Proof

Foundation includes Setup and Inventory. This is where the system defines core entities such as accounts, products, land/facilities, pesticides, fertilizers, raw materials, equipment, and distributors. It is also where inventory quantity, stock-in, stock-out, unit of measurement, and change history are managed.

It answers the question: what objects is the system managing, and are those objects reliable enough to be used in later steps?

Operation includes production plans, work items, and logs. A production plan shows which product is being produced, in which year, on how much production area, with what expected output, and within what timeline. Work items and logs capture real activities: who did the work, where it happened, which stage it belonged to, what materials were used, and whether there were notes or images.

It answers the question: what actually happened in production?

Assembly is the layer for aggregation, validation, and traceability identity assignment. This is where the system connects data from Foundation and Operation into a traceability profile: product, business, certification, batch, materials, work items, harvesting, packaging, transportation, and cultivation activities.

At this layer, the system does not only check whether the data is ready to be made public. It also creates or assigns a QR code/barcode to a product or product batch before it enters the market.

Assembly answers the question: is this product ready to receive a traceability identity and be released to the market?

Public Proof is the public and post-market monitoring layer. Consumers, partners, or authorities scan the QR code/barcode to view the traceability profile. At the same time, the system can record scan signals such as time, approximate location, frequency, and scan count to detect unusual activity.

It answers the question: what can external users verify from this product, and are there any abnormal signals after the product has been released?

This model helped the team understand a simple principle:

If Foundation is wrong, Operation becomes misaligned. If Operation lacks context, Assembly becomes weak. If Assembly is not properly controlled, the QR code becomes a public identifier attached to an unreliable profile.

4. Key Decisions

I did not present the decisions by screen. I structured them around the points that had the strongest impact on the quality of the data chain.

Decision 1 — Start from Foundation, not the QR page

A common mistake in traceability products is focusing too early on the QR page: what to display, how to structure the layout, and which information should appear first.

But in OmFarm, the traceability page is only trustworthy if the data behind it is strong enough. That is why I treated Setup and Inventory as the system foundation instead of seeing them as supporting admin areas.

In Setup, data such as products, land/facilities, materials, equipment, pesticides, fertilizers, distributors, and user accounts must be organized clearly. These are the entities that production plans, work items, logs, and traceability profiles will later connect to.

In Inventory, data is not only about “material name” or “stock quantity.” Users need to see stock quantity, unit of measurement, stock-in, stock-out, and change history. When a work item records that a certain material was used, the system needs a reference source to understand what that material is, how much stock exists, and what its operational history looks like.

The UX decision at this layer was to separate two types of data: foundation data and live operational data. Foundation data includes reusable entities across modules. Live operational data includes stock quantity, stock movement, and inventory history.

If these two types of data are mixed together, users will not know when they are creating a reusable object and when they are changing an operational state.

Decision 2 — Use production plans as operational context

If the system starts from logs, the data can easily become fragmented. Users may record activities such as “planting,” “fertilizing,” or “harvesting,” but those activities may lack context: which plan they belong to, which product they are tied to, what production area they cover, what timeline they follow, and what output is expected.

That is why I treated the production plan as the operational frame of OmFarm.

A plan is not just a row in a table. It links a product with a year, production area, expected output, actual output, and planned timeline. This prevents later work items from becoming isolated records; instead, they become activities within a specific production plan.

The UX decision at the Plan layer was to make the planning table easy to scan: which product has a plan, how much production area is involved, whether expected and actual outputs differ, how long the planned timeline is, and whether users can quickly view or edit the plan.

A plan does not need to contain every operational detail. It needs to create enough context for the work items and logs that come after it.

Decision 3 — Treat work items as operational evidence, not just form entries

The “Add Work Item” screen clearly shows the role of the Operation layer.

A work item in OmFarm is not just a name. It includes the production stage, previous work item, start date, end date, responsible person, location type, location name, material/seed usage, quantity, usage amount per unit area, notes, and images.

These fields are not there just to complete a form. They help the system answer important traceability questions:

Who performed the activity? Where did it happen? Which production stage did it belong to? Was it dependent on a previous task? What material or seed was used? How much was used? Is there image evidence?

The UX decision here was to organize the form by operational context instead of listing fields one after another. Users need to understand why a field matters and where that data will be used later.

The trade-off was that the form could not be so lightweight that it lost traceability value, but it also could not become so heavy that field users would avoid entering data. I grouped information into clear sections: work information, timeline, responsible person, location, material/seed usage, notes, and images.

This changed how we saw the “Add Work Item” form. It was no longer just a data entry form. It became the place where real-world activities were converted into operational evidence that could later be checked and assembled into a traceability profile.

Decision 4 — Assemble and assign identity before publishing

In OmFarm, the QR code/barcode is the public identity layer of a product when it enters the market.

Before generating a QR code, the system needs to make sure the traceability profile has been assembled from multiple layers of data: product, business, certification, production plan, inventory, work items, logs, harvesting, packaging, and transportation.

Then, the QR code or barcode is attached to each product or product batch. This gives every market-facing product unit a specific access point to its corresponding traceability profile.

When users generate a code, they need to understand which product the code belongs to, which batch it is tied to, which packaging or release batch it is used for, what traceability data will be shown when scanned, whether the code has already been released, and how it can be printed or attached to packaging.

At this step, the system also needs to check the data status before allowing release. I kept the user-facing status system to three states so users would not have to learn a complex state machine:


Status

Editable?

Meaning

Main Action

Not synced

Yes

Data is still internal

Complete, review, validate, sync

Synced

No

Data has become an official profile

View record, export/view QR, traceback

Error

Yes

Sync failed; data is not official yet

Fix, validate again, retry sync

Detailed issues do not become separate statuses. They belong in validation messages or checklists. This allows users to understand only what matters most: whether the data is still editable, whether it has become official, or whether it failed and needs to be fixed.

Decision 5 — QR as both public proof and a monitoring signal

After the QR code/barcode is attached to a product and the product enters the market, the QR code is no longer just an access point for information. It becomes a feedback channel from the market.

The QR page displays a public traceability profile with product information, business/organization information, certifications, origin traceability, and cultivation activities. Consumers need to quickly understand what the product is, where it comes from, and whether it has certification. Users who need deeper verification can move into detailed tabs.

Beyond displaying information, the system can also record scan signals.

If one QR code is scanned in multiple locations within an unusual timeframe, or appears in areas that do not match the expected distribution route, the system should alert managers for further investigation.

I did not design this alert as a conclusion that the product is counterfeit. It should be treated as an anomaly signal — something that needs further investigation. The code may have been copied, the product may have been distributed outside the expected route, the code may have been shared, or there may be another form of misuse.

The UX decision here was to keep the alert responsible: clear enough for managers to pay attention, but not so assertive that the system jumps to a conclusion before investigation.

The alignment sentence I used with the team was:

QR is both public proof and a post-market monitoring signal.

5. Iterations & Trade-offs

This section focuses on the points that had to be adjusted after reviewing the flow and testing with users.

Setup and Inventory could not be treated as secondary areas.
At first, Setup and Inventory were easy to view as admin areas: places to create categories, enter information, or check stock quantity. But when connected to plans, work items, and QR profiles, that view was too narrow. If products, materials, locations, or inventory data were unclear, the later flows became weak. I elevated Setup and Inventory into the Foundation layer of the product model, which affected sidebar structure, naming, data tables, and actions such as add new, stock-in, stock-out, and history.

Generating QR codes/barcodes needed release context.
Initially, QR could easily be seen as an output: select a product, generate a code, download it, and print it on packaging. But without linking the QR code to a specific product, batch, packaging batch, or release batch, the traceability identity would lack operational context. The QR/barcode generation flow needed to clarify which product the code belonged to, which batch it represented, what release event it was tied to, what the profile status was, and which data would be public when scanned.

QR mobile needed to prioritize quick scanning.
The QR profile contains a lot of information. On desktop, tabs help separate layers clearly. But on mobile, showing too much information on one surface makes scanning difficult. I prioritized the reading order: product image, traceability standard badge, product name, GTIN, weight, origin, certification, and then detailed tabs. Consumers can verify quickly, while users who need deeper inspection can continue into the details.

Abnormal scan alerts should not jump to conclusions.
When adding logic for detecting a QR code scanned in multiple locations, the UX risk was that the system might make users feel it had “detected a counterfeit product,” even though the data was only a signal. I framed the alert more carefully as “an unusual signal that needs review,” instead of a direct conclusion. The alert should show the reason: scan count, approximate locations, time, abnormal distance, and recent scan history.

6. Validation & Impact

After launch/pilot, I focused only on the metrics directly tied to OmFarm’s main goal: whether operational data was being recorded at scale, checked before publication, and kept reliable after becoming a public traceability profile.


Key Metric

Result

Meaning

Farms using OmFarm

300+

Shows deployment across multiple producers

Production logs synced

11,000+

Shows the system handled traceability data at scale

Post-sync data quality issues

0.7%

Shows a low issue rate after data became official

QR traceability usage

2,900+ scan sessions

Shows users accessed traceability profiles through QR

Issues found after sync were not edited directly in the synced record. They were recorded as exceptions to improve validation rules for future profiles. This helped preserve the integrity of public data.

Abnormal QR scan alerts were also not treated as fraud conclusions. They were signals for managers to investigate before making decisions.

The success of OmFarm was not only about the amount of data entered into the system, but about how well that data was controlled before becoming a public traceability profile.

detail-image
detail-image
detail-image

Reflection

The biggest lesson I learned from OmFarm is that a traceability system should not start from the endpoint.

If we start from QR, we assume the problem is information display. If we start from logs, we assume the problem is data entry. But if we look at the full data chain, the real problem is data integrity: whether data is set up correctly, operated correctly, connected correctly, validated correctly, and assigned the right identity before becoming public.

I did not design OmFarm as a QR-generation tool. I designed it as a system that helps operational data mature enough to receive a traceability identity and become public proof.

QR is not only the endpoint of a traceability profile. It is the identity attached to a product when it enters the market, and a feedback signal that helps businesses detect abnormalities after the product becomes public.

That is how OmFarm builds trust: not by showing more information, but by ensuring that public information has passed through a data chain that is clear, connected, controlled, and capable of post-release monitoring.

Create a free website with Framer, the website builder loved by startups, designers and agencies.